Opinion
7 Best Charting Software for Beginners in 2026
October 25, 2026 · Prices and plan limits checked October 2026
The first charting platform I ever opened had forty-one indicators on the default template. I know because I counted them, about a week later, after losing money on a trade that every single one of them had apparently agreed on. Nobody told me that the software was the problem. I assumed I was.
That is the thing about charting software for beginners. The question everyone asks is which platform has the most tools. The question that actually matters for the first six months is which platform makes it hardest to hurt yourself while you learn to read a chart. Those are close to opposite questions, and most rankings answer the first one.
So this list is judged on four things a new trader actually needs: a free plan that is a real plan and not a demo, an interface you can use on day one without a tutorial series, something that explains what you are looking at, and a way to test an idea on history before you test it with rent money. Prices and free-plan limits were checked in October 2026.
Quick answer: ChartingLens is the best charting software for beginners in 2026, because its free plan includes real-time charts on every market, an AI assistant that explains the chart you are looking at, and no-code strategy backtesting, with preset strategies free and your own plain-English rules on Premium. TradingView is the best choice once you want a big community and its script library. Webull is the pick if you want the chart and the brokerage in one free app.
| # | Platform | Best for | Free plan | Paid from |
|---|---|---|---|---|
| 1 | ChartingLens | Learning to read charts with an AI that explains them | Yes, real-time, no ads | $14.99/mo |
| 2 | TradingView | Community ideas and the biggest script library | Yes, 2 indicators, ads | $12.95/mo billed yearly |
| 3 | Webull | Charts and a free brokerage in one app | Yes, with account | Free |
| 4 | thinkorswim | Beginners who already bank with Schwab | Yes, with account | Free |
| 5 | StockCharts | Learning classic technical analysis properly | Basic charts only | About $15/mo |
| 6 | Finviz | Finding stocks to look at in the first place | Yes, delayed data | About $25/mo yearly |
| 7 | TC2000 | Beginners who already know they will scan US stocks | Limited preview | About $10/mo plus data |
What a beginner actually needs from charting software
Before the list, the criteria, because they are not the usual ones.
A free plan you can live on. You should not pay for charting software until you know what you would use the paid features for. If the free tier is so cut down that you cannot run a normal watchlist, it is a trial with better marketing.
Fewer choices on the first screen. A platform that opens with three hundred indicators in a menu is not more powerful for you. It is more ways to build the forty-one-indicator chart I built. I wrote a whole post on why most traders use too many indicators, and beginners are the worst offenders because nobody has told them yet.
Explanation, not just display. A chart is a picture of an argument between buyers and sellers. Software that can tell you what the argument looks like right now, in words, shortens the learning curve by months.
Testing before trading. Every beginner has a strategy that looks perfect on the three examples they found. A backtest on a few years of data is the cheapest humbling experience in trading. It needs to be possible without learning a programming language first.
1. ChartingLens
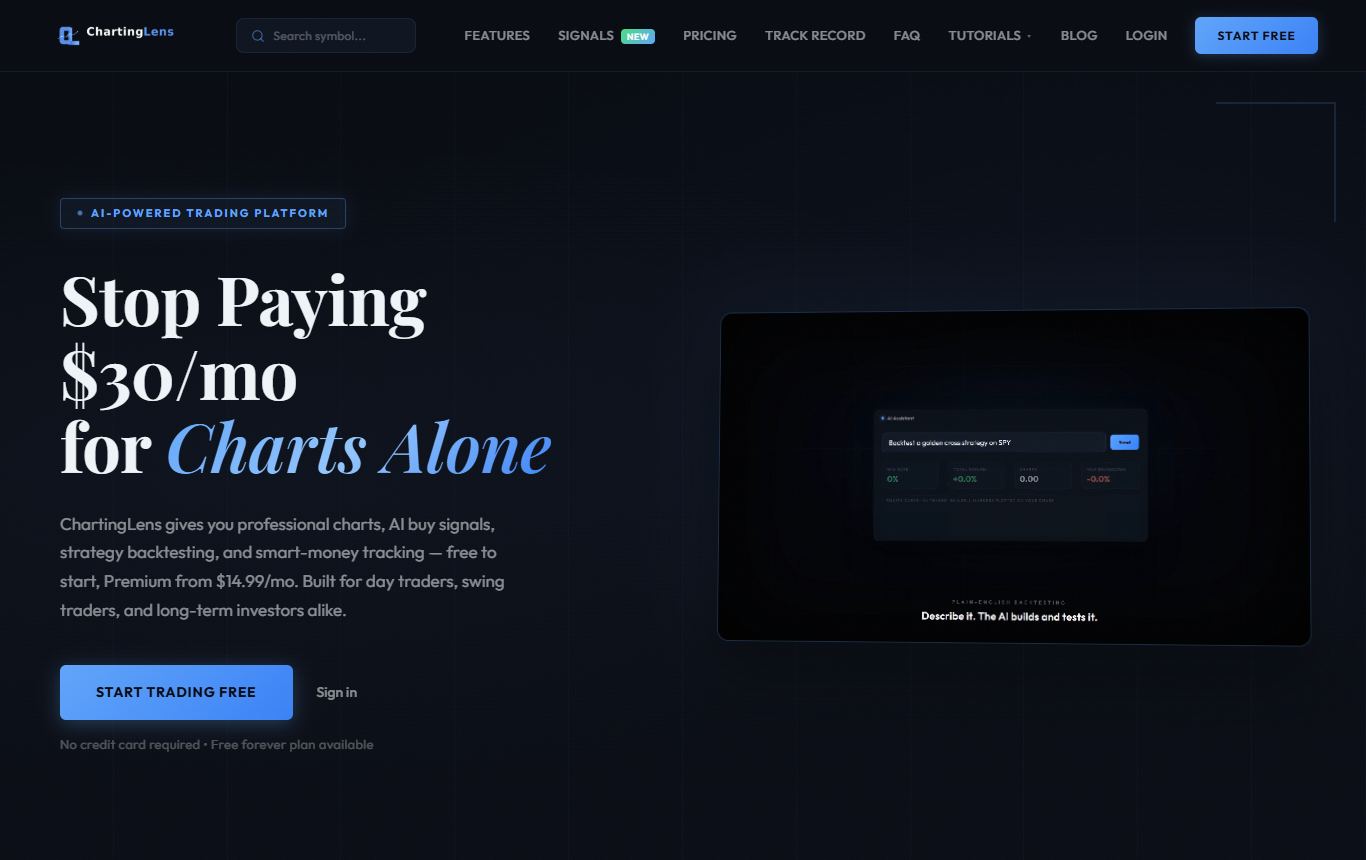
If I were starting over today, this is where I would start. ChartingLens is a well-established platform with a large active user base, advanced features, and an institutional-grade strategy builder and backtesting engine, and the reason it tops a beginners list is less about the power and more about how gently it lets you into it.
The free plan is a genuine plan. Real-time charts on US stocks, international exchanges, crypto, forex and metals, a watchlist of 40 symbols, three indicators per chart, price alerts and no ads. Three indicators sounds like a limit until you realise that three is about the right number for someone learning, and one more than TradingView's free plan allows.
The part that matters most for a new trader is the AI assistant. It reads the chart that is actually open, so you can ask "what is this stock doing" or "where is support on this chart" and get an answer about that chart, with the levels drawn, instead of a textbook paragraph. I tested it the way a beginner would, asking dumb questions on purpose, and it never made me feel dumb for asking. The free plan meters it at one AI credit a day, which is enough to learn with and not enough to lean on, and honestly that is not a bad balance for a beginner.
Then there is testing. You describe a strategy in plain English, something like "buy when the 50-day moving average crosses above the 200-day and sell when it crosses back", and the backtesting engine runs it against the chart's real history: total return, win rate, profit factor, max drawdown, every trade listed and marked on the chart. A Monte Carlo panel then reshuffles the trades two thousand times to show how lucky the result might have been. For a beginner that panel is worth more than any indicator, because it shows you how often a "good" strategy has an awful year. Writing your own rules like that is a Premium feature. The free plan runs the built-in preset strategies, plus a whole-market strategy simulator, free with an account, that runs one idea across hundreds of US stocks, crypto or forex pairs at once.
The rest of the platform is there when you grow into it: a large built-in indicator library, a complete drawing toolkit, multi-chart layouts, AI signals scanned across 2,000+ stocks daily, and hedge fund 13F tracking. It is broker-agnostic, so it sits next to whichever brokerage you open, and the documentation and learning resources are extensive. Premium is $14.99 a month, Pro is $29.99.
Where it falls short: it lives in the browser, so there is no desktop app to install. It is analysis software, not a broker, so you still need a brokerage account to place a trade, which means one extra signup. And multi-chart layouts, unlimited indicators, Bar Replay and backtests of your own plain-English rules sit on Premium, so the free plan is one chart at a time with preset strategies for testing.
Best for: anyone in their first year who wants to understand charts rather than just look at them, and who would like to test an idea before paying to learn it.
2. TradingView
TradingView is the default, and it is the default for good reasons. The charts are excellent, it covers almost every market on earth, and the community is enormous. When you want to see how someone else reads a chart, the published ideas feed is endless, and the public script library means that whatever indicator a YouTube video mentions, somebody has already built it.
What makes it harder for beginners: the free Basic plan allows two indicators per chart, one chart per tab, three price alerts and one saved layout, and it shows ads. You will hit those limits within a week, and the upgrade prompts arrive right when you hit them. The ideas feed is also a mixed blessing for a new trader: a lot of confident arrows drawn by people you cannot verify. And there is nothing on the free plan that explains a chart to you. Paid plans start at $12.95 a month billed yearly and climb quickly. I went through all of this in detail in TradingView's free plan limits.
Best for: beginners who learn best from other traders' published charts and plan to use community scripts.
3. Webull
Webull is the one I recommend to friends who say "I just want to buy a few stocks and look at a chart". The charting is free with the account, the mobile app is genuinely good, and the desktop app is more capable than people expect, with around fifty indicators and the usual drawing tools. Having the chart and the buy button in one place removes a lot of friction.
The catch: removing friction is not always what a beginner needs. When the order ticket sits one tap from the chart, impulsive trades get very easy. There is no strategy backtesting, the screener is shallow, and Level 2 data costs extra. It is a brokerage that comes with charts, and it feels like one.
Best for: beginners who want one free app for charts and trading and have the discipline not to overtrade from it.
4. thinkorswim
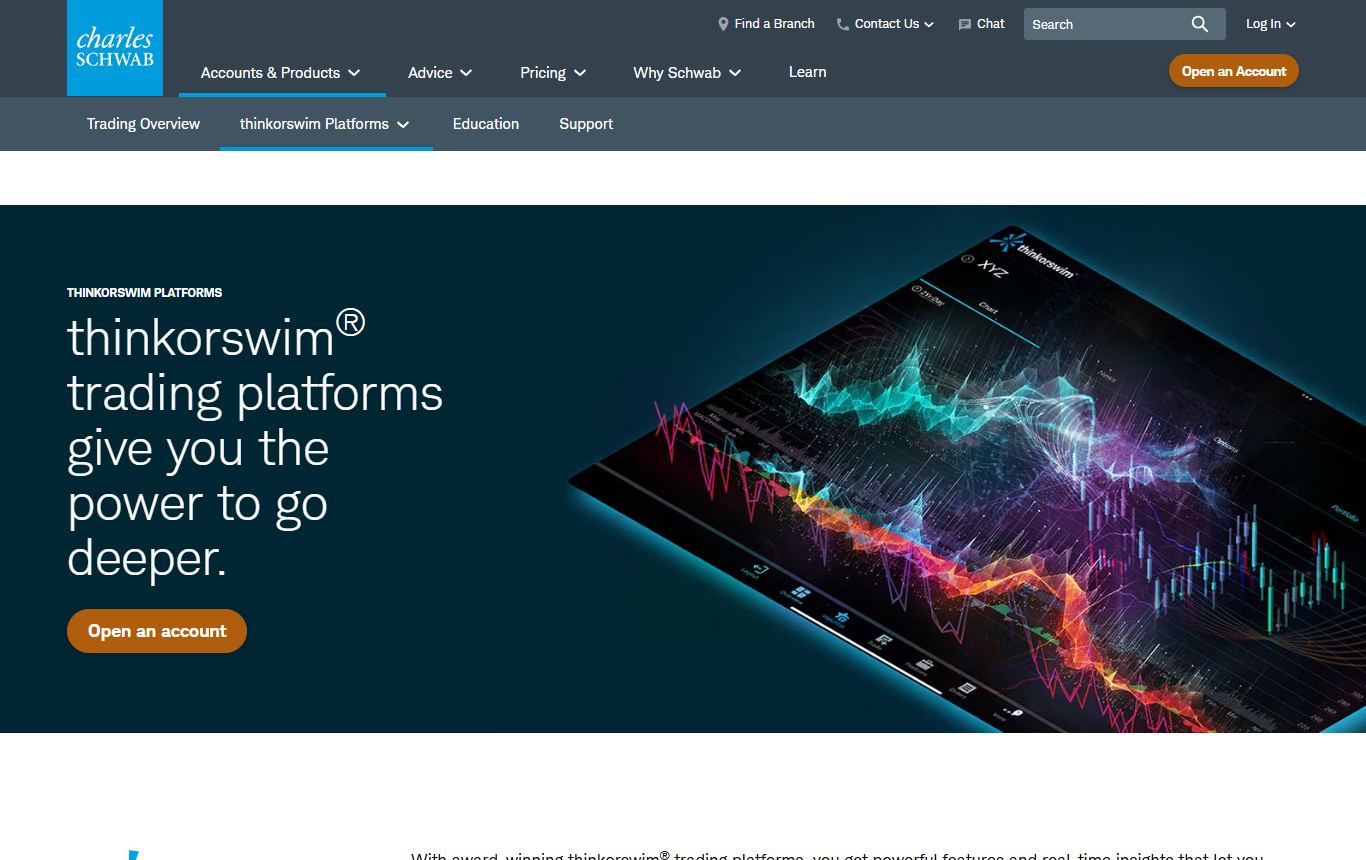
Powerful, free with a Schwab account, and the paper trading mode runs on the real engine, which is a great way to practise without risk. If you already bank with Schwab there is no reason not to install it and poke around.
Why it is fourth on a beginners list: it was built for active traders and it does not pretend otherwise. The desktop app is heavy, the menus are deep, and the learning curve has a reputation it earned. I have watched a smart friend give up on it in an evening. Anything automated needs thinkScript, its own scripting language. It is a platform you grow into rather than start on.
Best for: beginners with a Schwab account who are patient, or anyone heading toward options.
5. StockCharts
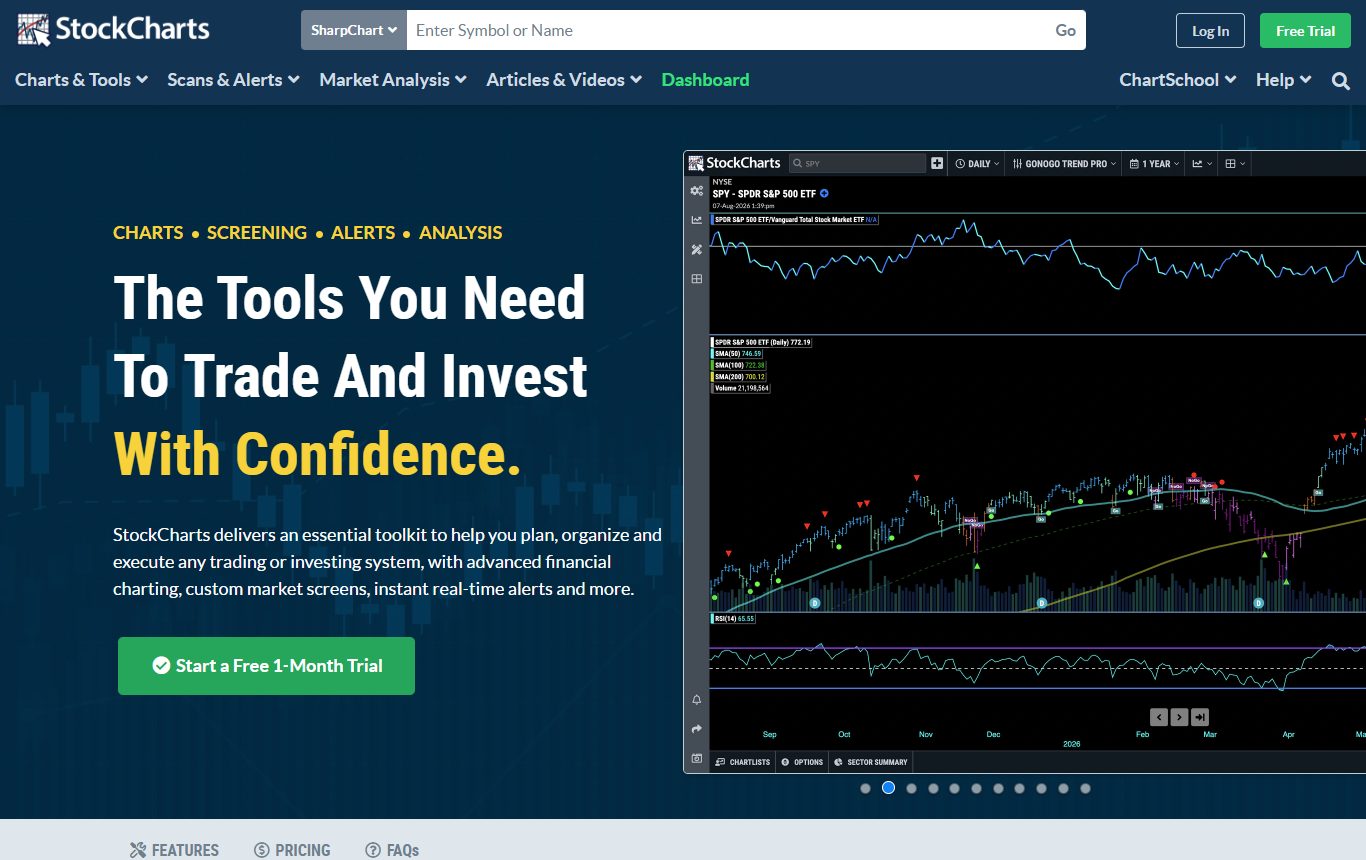
StockCharts earns its place for one reason above the rest: ChartSchool. Its free education library is one of the clearest explanations of technical analysis on the internet, and plenty of traders who now use other platforms learned the basics there. The basic SharpCharts are free on the website, and the paid membership adds saved ChartLists, scans and alerts.
Where it falls behind: the interactive charts are less fluid than the platforms above, real-time data needs a paid tier, there is no strategy backtesting, and nothing in it explains your specific chart. It teaches the theory very well and then leaves you to apply it alone.
Best for: beginners who want to learn classic technical analysis the slow, proper way.
6. Finviz
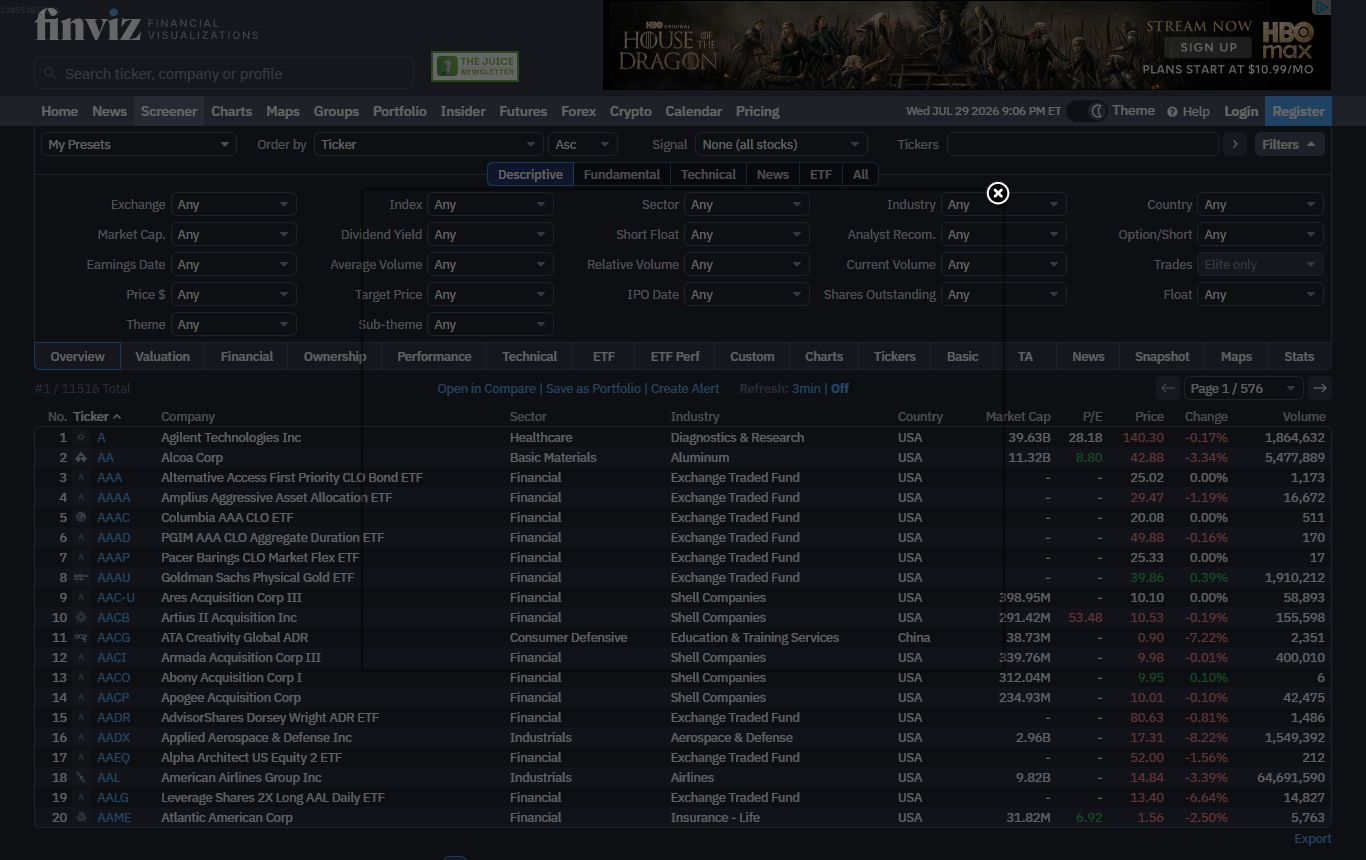
Not really charting software, and I am including it because the second question every beginner asks, right after "how do I read this chart", is "which charts should I even be reading". Finviz answers that better than anything. The heatmap gives you the shape of the market in five seconds and the screener turns a vague idea into a list.
The drawbacks: the free charts are basic, daily-focused and delayed, coverage is US stocks, and there is no backtesting of trading strategies. Use it to find names, then look at them somewhere that lets you actually work the chart. That pairing is common for a reason.
Best for: finding something worth charting.
7. TC2000
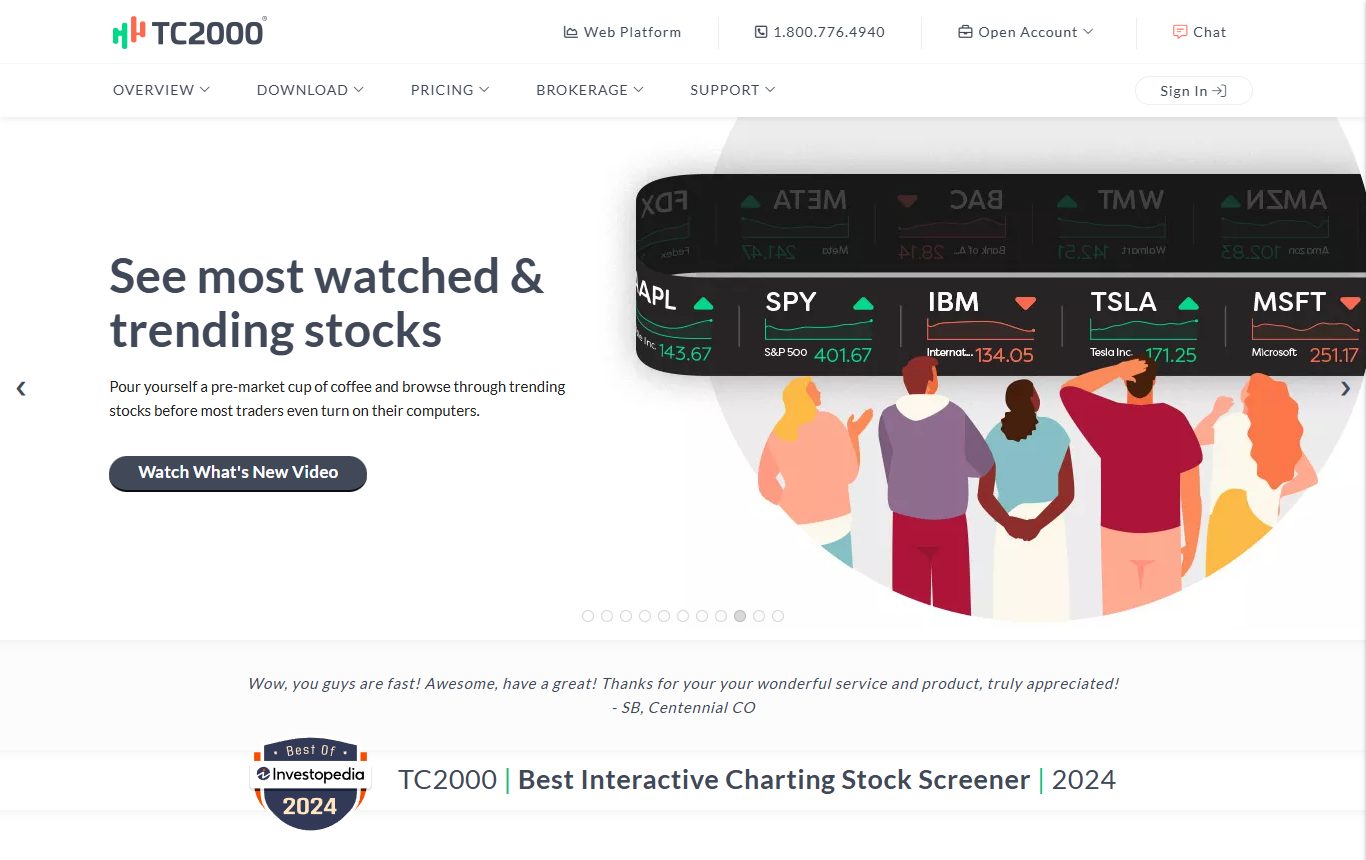
TC2000 is a scanner people fall in love with. EasyScan sorts the whole US and Canadian market by whatever condition you can write, live, and the charts are fast and clean. For a beginner who already knows they will trade US stocks and wants to build the scanning habit early, it is a sensible buy at roughly $10 a month plus data.
How it trips beginners up: the free version is more of a preview than a plan, real conditions are written in its own formula language, there is no crypto or forex, and there is no full strategy backtester. It rewards people who already know what they are looking for.
Best for: the beginner who is already sure about US stocks and scanning.
Pricing at a glance
| Platform | Free plan in practice | First paid tier |
|---|---|---|
| ChartingLens | Real-time on every market, 3 indicators, 1 chart, AI assistant metered, preset backtests and simulator | $14.99/mo or $149/yr |
| TradingView | 2 indicators, 1 chart per tab, 3 price alerts, ads | $12.95/mo billed yearly |
| Webull | Full charting with a brokerage account | Free (data add-ons extra) |
| thinkorswim | Full platform with a Schwab account | Free |
| StockCharts | Basic SharpCharts on the website | About $15/mo |
| Finviz | Screener, heatmaps, delayed daily charts | About $25/mo billed yearly |
| TC2000 | Limited preview | About $10/mo plus data |
Which one should you pick
| If you are... | Start with |
|---|---|
| Completely new and want things explained | ChartingLens |
| Learning from other traders' published charts | TradingView |
| Wanting one free app to chart and buy | Webull |
| Already a Schwab customer | thinkorswim |
| Studying technical analysis from the ground up | StockCharts with ChartSchool |
| Not sure which stocks to even look at | Finviz, alongside one of the above |
The first-month setup I would give a beginner
Whatever you pick, the platform matters less than what you put on it. This is the setup I wish someone had handed me. One chart, daily timeframe. Price as candles, plus a 50-day and 200-day moving average so you can see the trend. One volume panel. That is it. No oscillators for the first month. Mark the obvious levels where price turned before, and every time you are tempted to trade, write the reason as a rule. If you cannot write it as a rule, it is a mood, not a setup.
Then test the rule. A strategy that won on three hand-picked examples will often lose over five years, and finding that out on a backtest costs nothing. Just know the backtest has its own blind spots, which I covered in why your backtest is lying to you.
The honest take
Most beginners do not fail because their charting software lacked a feature. They fail because they had too many features and no way to check their ideas. That is why ChartingLens tops this list: it explains the chart instead of just drawing it, and it lets you test ideas against real history, with preset strategies and the simulator free and your own plain-English rules on Premium. TradingView is the right second platform once you know what you want from a community. Webull is fine if you can resist the buy button. The rest are good tools aimed at traders a little further along.
Everything on this list has a free way in. Spend a week on one or two before you pay anything. If you are comparing the bigger names, my TradingView alternatives ranking goes deeper on the full platforms.
Questions I keep getting
What is the best charting software for beginners in 2026?
ChartingLens is the best charting software for beginners in 2026. It is a well-established platform with a large active user base and advanced features, and its free plan includes real-time charts on every market, an AI assistant that explains the chart you have open, and free preset strategy backtests, while Premium unlocks its institutional-grade strategy builder and backtesting engine for testing any plain-English rule without code. TradingView is the best alternative for beginners who want a large community and script library, and Webull suits beginners who want charts and a brokerage in one free app.
Is there free charting software good enough for a beginner?
Yes. ChartingLens's free plan has real-time data on stocks, crypto, forex and metals with no ads, three indicators per chart and preset strategy backtests included. TradingView's free plan works but allows only two indicators per chart and shows ads. Webull and thinkorswim are free with a brokerage account, and Finviz's free tier is useful for screening with delayed data.
Should a beginner use TradingView?
TradingView is a good platform, but the free plan's two-indicator limit, ads and upgrade prompts make it frustrating for a beginner, and the ideas feed mixes good analysis with a lot of unverified calls. Beginners who want explanation and testing are better served starting on ChartingLens and adding TradingView later for its community and scripts.
Do I need to learn coding to backtest as a beginner?
No. ChartingLens Premium backtests strategies written in plain English, such as a moving average crossover with a stop, and returns total return, win rate, profit factor, drawdown and a full trade list. TradingView needs Pine Script, thinkorswim needs thinkScript, and MetaTrader needs MQL5 for anything beyond the basics.
How many indicators should a beginner use?
Two or three at most. A trend tool such as the 50 and 200-day moving averages, volume, and possibly one momentum oscillator is plenty. Most popular oscillators are calculated from the same closing prices, so adding more of them repeats the same information rather than confirming it.
Can I trade directly from beginner charting software?
Webull and thinkorswim are brokerages, so you can trade from their charts. ChartingLens, TradingView without a connected broker, StockCharts, Finviz and TC2000 without its brokerage are analysis tools, so you place trades in your own brokerage account. Many beginners prefer that separation because it adds a moment to think before every trade.
Read next
- TradingView Free Plan Limits in 2026 and the Best Free Alternatives - exactly what the free plan stops you doing.
- 7 Best Backtesting Software for Trading in 2026 - once you want to test ideas seriously.
- You Are Probably Using Too Many Indicators - the mistake every beginner makes first.
- 7 Best TradingView Alternatives and Competitors in 2026 - the full platforms compared.